
Spinifex Platform Benchmark on Cisco UCS (3-Node)
Measured CPU, disk, network, and S3 performance of Spinifex on a 3-node Cisco Unified Edge cluster, comparing host against guest with Intel AMX confirmed.
Overview
Spinifex is an open-source infrastructure platform that brings core AWS services — EC2, S3, EBS and EKS — to bare-metal, edge, and on-prem deployments, exposing a fully AWS-compatible API.
This document characterizes the platform itself on a 3-node Cisco Unified Edge cluster, independent of any specific application: CPU, disk, network, and S3 (Predastore) throughput measured identically on bare metal and inside guest instances, and how many concurrent worker processes each instance can sustain before latency degrades.
Companion documents: Spinifex Vision Pipeline on Cisco UCS · vLLM Serving on Cisco UCS: Intel AMX vs NVIDIA L4
Platform
| Component | Specification |
|---|---|
| Chassis | 3× Cisco Unified Edge, single-socket each |
| CPU | 1× Intel Xeon 6543P-B per node — 32 cores / 64 threads, 800 MHz–3.30 GHz |
| Cache / NUMA | L3 128 MB (unified), single NUMA node — no vCPU/memory locality tuning needed |
| ISA | AVX-512 (F/DQ/BW/VL/VNNI/BF16/FP16), Intel AMX (tile/BF16/INT8), VT-x, VT-d |
| Memory | 499 GiB usable per node (≈1.5 TiB aggregate) |
| GPU | 1× NVIDIA L4 (23,034 MiB) via VFIO PCIe passthrough on one node; the other two nodes are CPU-only |
| Storage | 4× KIOXIA CD8P NVMe (1.92 TB each) per node, raw — Predastore/Viperblock claim these directly |
| Boot | Cisco SATA RAID VD (Marvell 88SE9230 controller) |
| Network | 2× Intel E825-C 25GbE ports per node, each its own bond: one for management/WAN (VLAN 1337, 1 Gbps upstream uplink), one dedicated to storage/cluster traffic (VLAN 1336, full 25GbE) |
| Aggregate | 96 cores / 192 threads, ~1.5 TiB RAM, ~23 TiB raw NVMe, 1× L4 GPU |
Single-NUMA-per-node is a meaningful simplification versus a typical dual-socket reference design — no vCPU/memory locality tuning required for VM placement. The GPU is present on one node only — GPU-accelerated instances are bound to that node, while CPU-only instances can schedule across all three.
Prerequisites
- 3-node Spinifex cluster installed and services healthy on all nodes — follow the Multi-Node Install guide.
- VPC, network pool, SSH key pair, and security group configured — see VPC Networking and Launching Instances
- GPU passthrough configured on the one node with the NVIDIA L4 — see GPU Passthrough:
sudo spx admin gpu setup   # reboot required after this step
sudo spx admin gpu enable- AWS CLI configured with
AWS_PROFILE=spinifexpointing at the cluster's EC2-compatible endpoint
Instructions
Benchmark scripts and raw results for all sections below are available in the platform benchmark repository.
1. Matched-width CPU
sysbench, identical thread counts, run on bare metal and inside a guest of the same vCPU width:
| Scope | Target | Median events/s |
|---|---|---|
| host | mulga-01 | 8,205.4 |
| host | mulga-02 | 8,209.3 |
| host | mulga-03 | 8,210.4 |
| guest | cpu1 | 8,168.4 |
| guest | cpu2 | 8,174.0 |
| guest | gpu | 8,160.8 |
Guests land within ~0.5% of host — virtualization overhead on this platform is negligible for CPU-bound work.
2. Confirm Intel AMX is actually executing
Intel AMX (Advanced Matrix Extensions) is a relatively new instruction set available on the Xeon 6543P-B, designed specifically to accelerate the matrix operations that dominate AI inference workloads. CPUID flags alone don't prove it's actually in use — the proof is oneDNN's own kernel-selection trace during a real inference run at each precision:
ONEDNN_VERBOSE=1 python3 <any BF16-hinted inference workload> 2> onednn-verbose.log
grep -o 'avx10_1_512_amx[a-z_]*\|avx512_core[a-z_]*' onednn-verbose.log | sort -u| Precision | Kernel selected |
|---|---|
| FP32 (forced, negative control) | avx512_core only — zero AMX kernel selections |
| BF16 | avx10_1_512_amx |
| INT8 | avx10_1_512_amx (+ one avx512_core fallback for an unquantized matmul) |
avx10_1_512_amx is the current kernel-naming scheme on this hardware generation — not the older brgemm_avx512_amx* string some documentation still references. Confirmed by direct trace inspection, not inferred from CPUID or throughput alone.
3. Disk — host versus guest
fio, file-backed (non-destructive), identical parameters on bare metal and inside a guest:
| Metric | Host (mulga-01) | Guest (cpu1, idle) | Ratio |
|---|---|---|---|
| Random 4K read | 4,460.8 MiB/s | 11.6 MiB/s | ~1/385 |
| Sequential 1M read | 7,122.6 MiB/s | 375.5 MiB/s | ~1/19 |
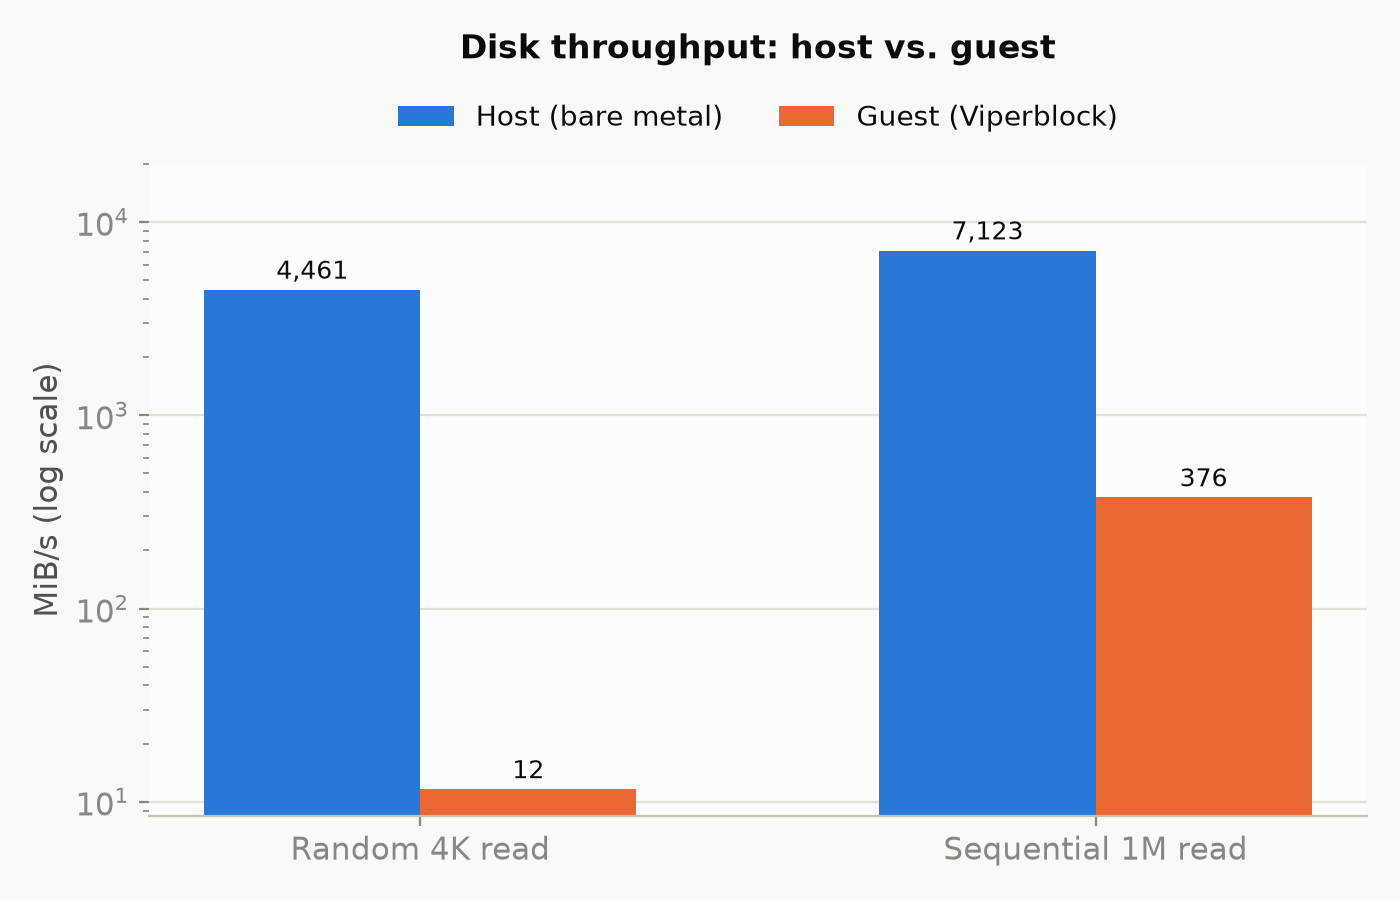
Guest I/O traverses Viperblock's NBD path; the random 4K gap is far larger than the sequential 1M gap because small requests pay the full per-request serialization overhead without amortizing it across a large transfer. This is a known area for improvement in upcoming Spinifex releases.
4. Network — physical fabric versus guest overlay
iperf3, matched methodology, on the physical storage fabric (bare metal) and between guest instances over the OVN/Geneve overlay:
| Path | Streams | Median Gbit/s |
|---|---|---|
| Physical storage fabric (bare metal) | 1 | 23.5 (≈94% of 25GbE line rate) |
| Guest↔guest | 1 | 13.4–20.0 |
| Guest↔guest | 2–4 | 14.5–19.0 |
| Guest↔guest | 16 | 10.3–13.3 |
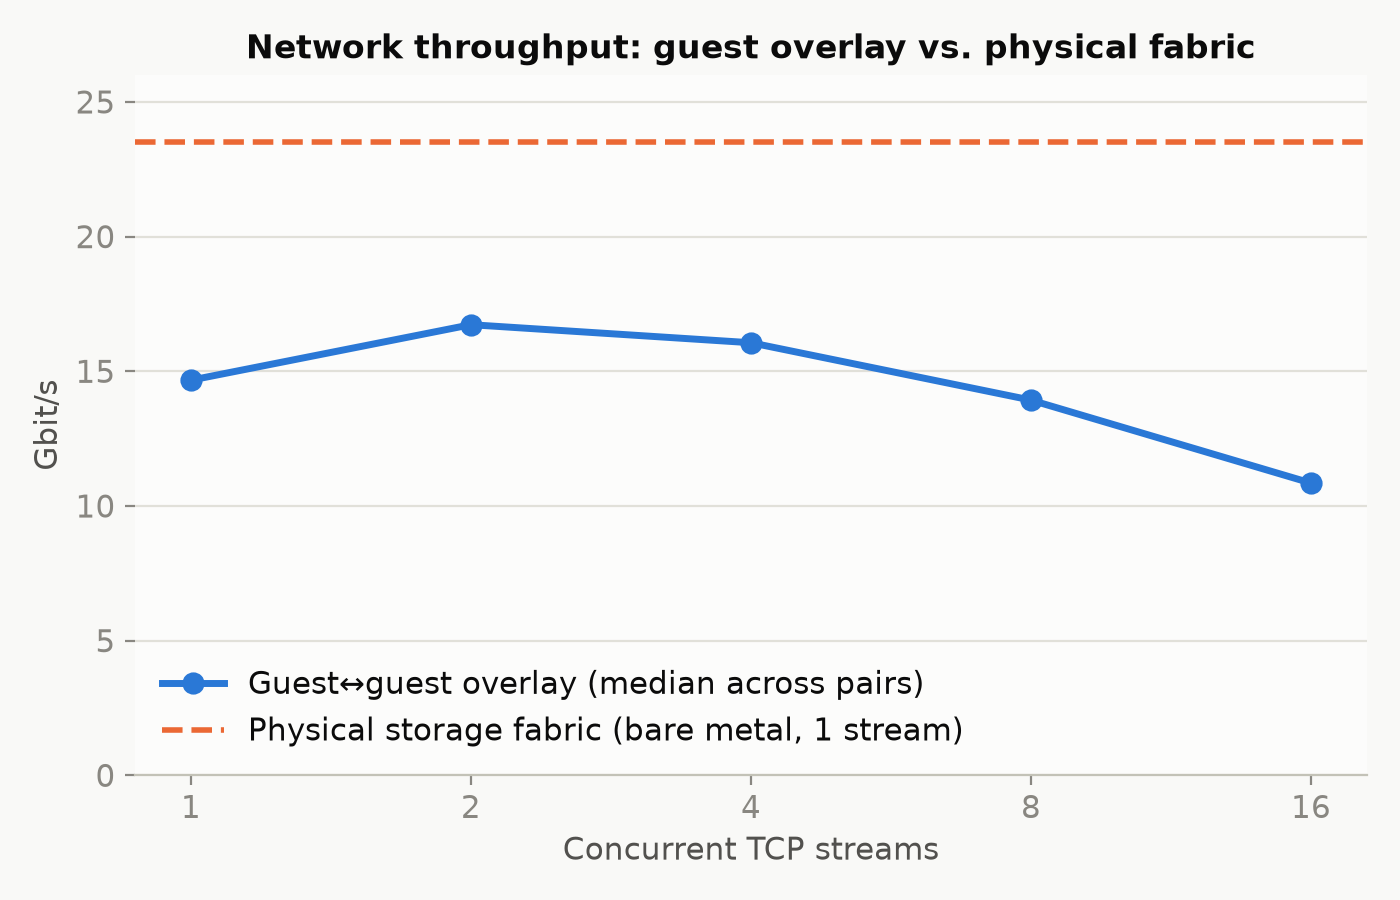
Guest-to-guest throughput lands 20–45% below the physical fabric depending on stream count and pairing.
The gap is primarily single-queue virtio-net — ethtool -l on all three guest instances reports Combined: 1 with no guest-configurable multiqueue support, concentrating all network work on a single core regardless of vCPU count. This explains why 16 concurrent streams perform *worse* than 1: they compete for the same queue rather than parallelizing. Geneve encapsulation reduces tenant MTU to 1408 (TCP MSS 1356), adding a smaller compounding overhead on top.
5. Predastore (S3) throughput
Three simultaneous clients per side, one per physical node, over HTTPS to the cluster's S3 endpoint:
| Direction | Guest-aggregate | Host-aggregate |
|---|---|---|
| Read | 175.1 MiB/s | 299.0 MiB/s |
| Write | 293.1 MiB/s | 124.1 MiB/s |
Reads run 1.71x faster on the host aggregate than guest. Write reverses — guests outperform the host (293.1 vs 124.1 MiB/s).
6. Worker concurrency per instance — how many processes can each node sustain
With one EC2 instance per physical node (3 instances fixed), we scale the number of concurrent worker processes within each instance from 1 to N, until p95 request latency exceeds 2x the single-worker baseline or aggregate throughput stops improving. Load generator: OpenVINO/YOLO11m inference against Predastore (CPU workers) and TensorRT/YOLO11m (GPU worker).
| Workers/instance | Total workers | Aggregate img/s | cpu1 p95 (ms) | cpu2 p95 (ms) | gpu p95 (ms) |
|---|---|---|---|---|---|
| 1 | 3 | 49.0 | 90.9 | 88.1 | 51.0 |
| 2 | 6 | 82.6 | 140.9 | 141.7 | 49.8 |
| 3 | 9 | 103.3 | 239.0 | 232.2 | 53.0 |
| 4 | 12 | 121.1 | 319.3 | 318.4 | 53.0 |
| 5 | 15 | 133.1 | 402.1 | 413.6 | 57.4 |
| 6 | 18 | 142.5 | 490.4 | 493.6 | 62.2 |
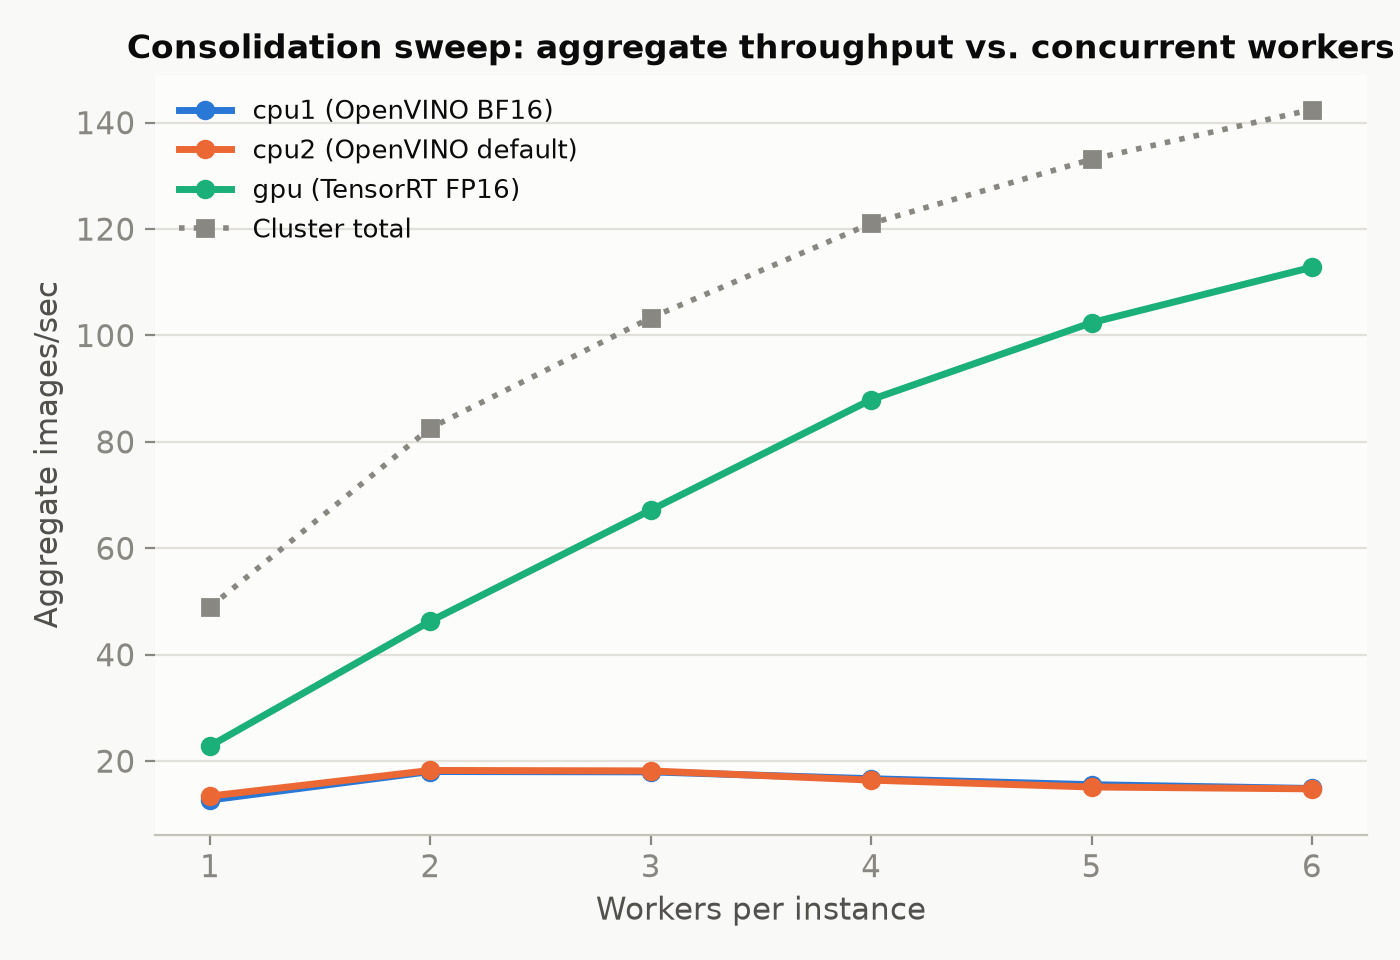
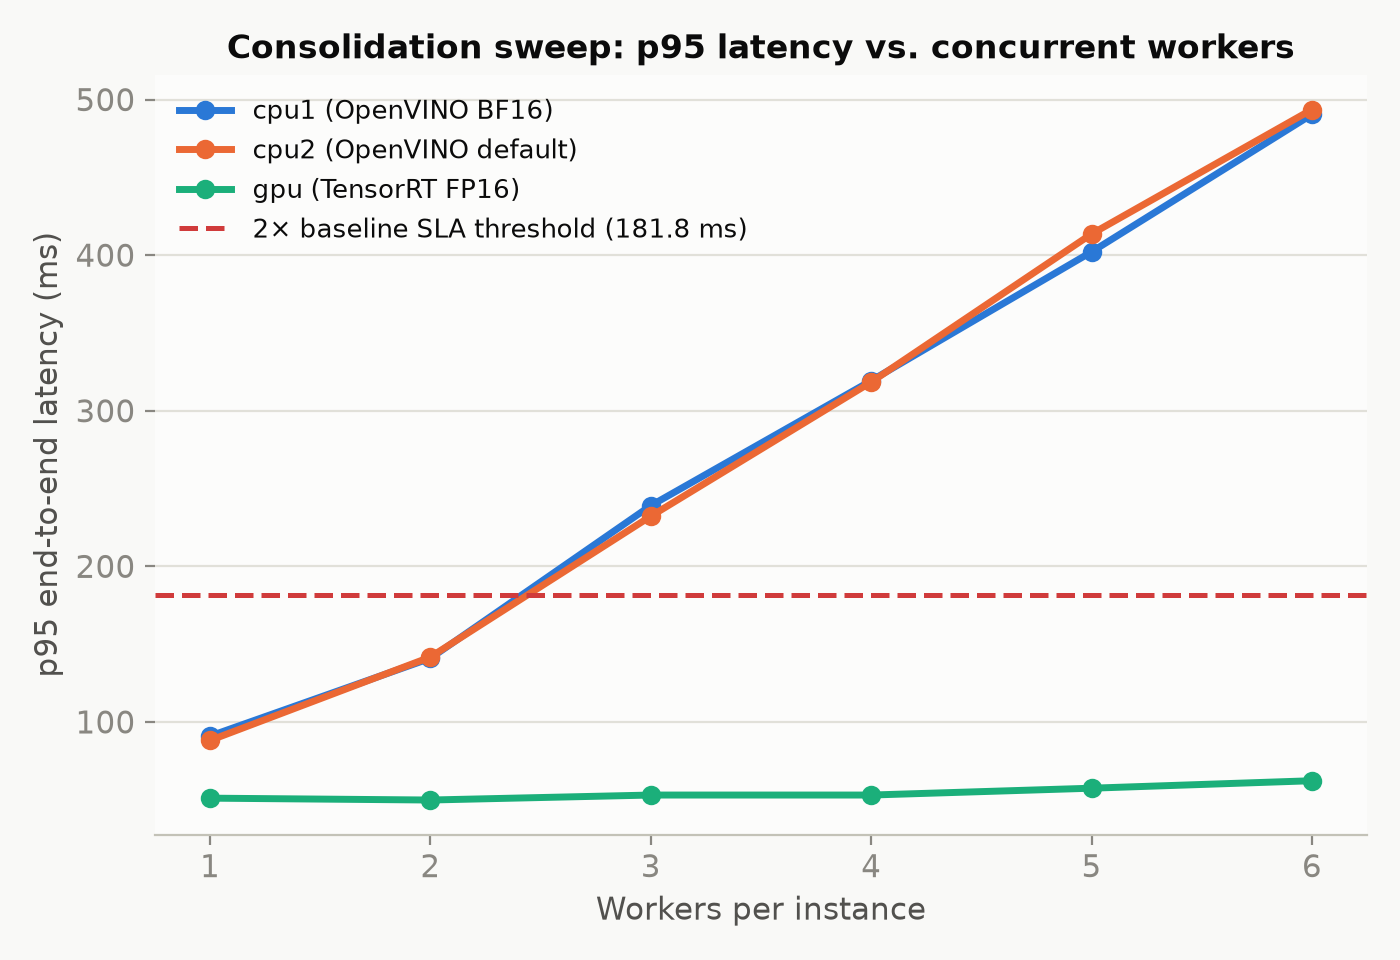
Both CPU workers track each other closely across the entire sweep (e.g. 18.05 vs. 18.25 img/s at N=2, 490.4 vs. 493.6 ms p95 at N=6), consistent with identical hardware on identical nodes.
CPU workers' aggregate throughput peaks at 2 workers/instance (~18.1 img/s each) and declines steadily from there (~16.6 at N=4, ~14.8 at N=6), while p95 latency climbs almost linearly with N (91–88 ms → ~490 ms, a ~5.4–5.6x increase over the sweep) — the 2x-baseline SLA is breached at 3 workers/instance (239.0 ms cpu1 / 232.2 ms cpu2 vs. a 181.8 ms / 176.2 ms threshold respectively) and never recovers. Both signals agree: the practical ceiling for this CPU-bound workload is 2 workers/instance (6/cluster) if throughput is the priority, or 2 if latency matters at all — by 3 it's already costing more than it gains.
The GPU worker shows no strain through the full sweep — p95 stays essentially flat (51.0–62.2 ms, well under its own 102.0 ms breach threshold) and aggregate throughput keeps climbing almost linearly through 6 workers/instance (22.85 → 112.82 img/s, a ~4.9x increase for 6x the load) — consistent with the L4 sitting at only 22–35% utilisation under a single worker. The sweep was capped at 6 workers/instance by design; the GPU's actual ceiling is higher and wasn't reached here.
Predastore itself is not the limiting subsystem for this result. mulga-01's Predastore CPU% is already elevated (85.4%) at N=1, briefly exceeds 100% at N=2 (119.0%, multi-threaded process accounting), and settles at 93.2% by N=6 — it fluctuates around a high baseline rather than climbing *with* N the way the observed CPU-worker degradation does, and the other two nodes' Predastore CPU% (27–50%) never comes close.
The cause is CPU-compute contention rather than storage or network: inference latency grows ~11x across the sweep while S3 read/write latency grows only ~24–40%, and each OpenVINO worker consumes roughly 3.5 cores unpinned — oversubscribing the 8-vCPU guest by N=3, which lines up exactly with the observed SLA breach.
7. Conclusion
On matched-width CPU work, guests cost virtually nothing versus bare metal (~0.5%), and Intel AMX is confirmed executing at the kernel-selection level, not just present in CPUID. Network and disk both show real overhead versus bare metal — guest network at 20–45% below the physical fabric, guest disk far more so, currently the platform's clearest area for near-term improvement. The practical ceiling for CPU-bound concurrent work is 2 worker processes per 8-vCPU instance before latency degrades — confirmed as compute contention rather than a storage or network ceiling — while the GPU instance shows no strain through the full sweep, consistent with the L4 sitting at 22–35% utilisation under a single worker.
All benchmark instances were provisioned through Spinifex's EC2-compatible endpoint using standard aws ec2 CLI calls — the same instance types, placement groups, and security groups that work on AWS work here unchanged. Teams already operating AWS infrastructure can point their existing tooling at a Spinifex node with a single profile swap.